This dialog is used for interactive calculations on functions. The dialog may be docked below the function list, which is default, or undocked as a floating dialog.
When → is selected the dialog is used to evaluate the selected function at a given value either entered in the dialog or traced with the mouse.
Below you can see the dialog, that appears when a standard function is selected. The dialog will look a little different when a parametric function, polar function or tangent is selected.
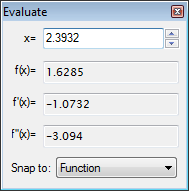
You can enter a value for which you want to evaluate the function. The value will be evaluated for the function selected in the function list. If the result is on the graph within the shown coordinate system, it will be marked with a dashed cross. You can also trace the drawn graph with the mouse. Just click on the graph with the mouse and the function will be evaluated at the nearest point.
It may happen that the result of an evaluation is a complex number with an imaginary part. This number will either be written as a+bi, a∠θ or not written at all depending of the choice under Options.
When you click with the mouse on the graphing area you may choose what the cursor will snap to:
- Function
The cursor will snap to the nearest point of the selected function.
- Intersection
The cursor will snap to the nearest intersection between the selected function and every function displayed (including the function itself).
- x-axis
The cursor will snap to the nearest intersection between the selected function and the x-axis.
- y-axis
The cursor will snap to the nearest intersection between the selected function and the y-axis. Not available for standard functions.
- Extreme x-value
The cursor will snap to the nearest local extreme value for the x-coordinate. Not available for standard functions.
- Extreme y-value
The cursor will snap to the nearest local extreme value for the y-coordinate.
When → is selected the dialog is used to calculate the area for the selected function over a specified domain range. For standard and parametric functions and tangents the area is the signed area between the graph and the x-axis (the real x-axis and not necessarily the visible one) for the given range. The area below the x-axis is considered negative. For standard functions and tangents, this is the same as the definite integral.
For polar functions, the area is the one between the graph in the given range and the origin. The area is considered negative when the angle goes from a higher to a lower value (clockwise).
You can either enter the range in the edit boxes or select the range with the mouse. The calculated area will be shown below the range, and the matched area will be marked with a shading in the coordinate system. The calculation is done using the Gauss-Kronrod 21-point integration rule adaptively with as much accuracy as possible. If an estimated relative error less than 10-4 cannot be reached, no result will be shown.
When → is selected the dialog is used to calculate the distance between two points on the function along the curve. You may either enter the range in the dialog or use the mouse to mark it. The range will be marked in the coordinate system. The calculation is done by converting it to an integration and using Simpson's formula through 1000 iterations.