This dialog is used to insert or edit text labels. To insert a label you use the menu item → . The label is inserted at the center of the graphing area, but can be dragged to another placement. To change an existing label, you either double click on it in the graphing area or you select it in the funktionslista and use → .
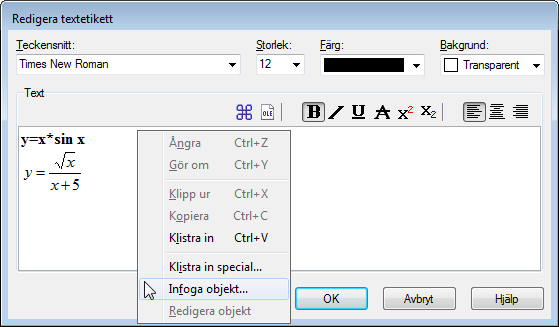
The text is entered in the editing area.
You can change text styles for different parts of the text.
The background color, which may be any solid color or transparent, can be set for the whole label only.
The  button can be used to insert special characters like mathematical symbols and Greek characters.
A text label can also contain any OLE object, for example an image or MS Equation. You can paste an OLE object into the editing area like text. A new object can be created at the cursor position by selecting in the context menu. If there is more than one representation in the clipboard, you can use in the context menu to select the representation to paste.
When the button is pressed, the label will be shown in the graphing area. The label can be moved by dragging it around with the mouse or it can be locked to one of the axes by right clicking on it and selecting a placement from the context menu. From the context menu it is also possible to rotate the label, for example to show the text vertically.
A label can contain and evaluate a numeric expression.
This is very useful when you want to show the value of custom constants in a label.
Graph will try to evaluate any expression in a label if placed in brackets after a percent sign (%).
If you have 3 custom constants a=2.5, b=-3, and c=8.75, you can create a label with the text f(x)=%(a)x2+%(b)x+%(c).
This label will be shown as f(x)=2.5x2-3x+8.75 in the graphing area.
When you change the constants, the label will be updated to reflect the new values.
In the above case, the + preceding %(b) is removed because b evaluates to a negative number.