The dialog below is used to add a shading to the selected function. To insert a new shading, you use → . To change an existing shading, you first select it in the function list and use → . The shading is used to mark an area between the function graph and something else.
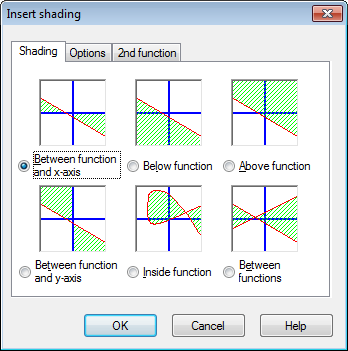
In the Shading tab you can choose between the following types of shadings:
- Between function and x-axis
This is the most commonly used type of shading. This will shade the area between the graph of the function and the x-axis in the selected interval. If you check Decrease to intersection or Increase to intersection, the interval will decrease or increase until the graph is crossing the x-axis.
- Between function and y-axis
This will shade the area between the graph of the function and the y-axis in the selected interval. This is rarely used and probably most useful for parametric functions. Notice that you still use the x-coordinates for the interval. If you check Decrease to intersection or Increase to intersection, the interval will decrease or increase until the graph is crossing the y-axis.
- Below function
This will shade the area below the graph of the function down to the bottom of the graphing area in the selected interval. If you check Decrease to intersection or Increase to intersection, the interval will decrease or increase until the graph is crossing the bottom of the graphing area.
- Above function
This will shade the area above the graph of the function up to the top of the graphing area in the selected interval. If you check Decrease to intersection or Increase to intersection, the interval will decrease or increase until the graph is crossing the top of the graphing area.
- Inside function
This will shade the area inside the graph of the function in the selected interval. If you check Decrease to intersection or Increase to intersection, the interval will decrease or increase until the graph is crossing itself. This is especially useful to shade a closed part of a parametric or polar function, but it can also be used to shade standard functions.
- Between functions
This will shade the area between the graphs of two functions. The first function is the one you selected in the function list in the main window, before you invoked the dialog. The second function is selected in the list box in the 2nd function tab. For standard functions, the interval will be the same for the two functions. For parametric functions, you may select different intervals for the two functions. If you don't select an interval for the second function, it will use the same interval as the first function.
At the Options tab shown below, you may change the options for the shading.
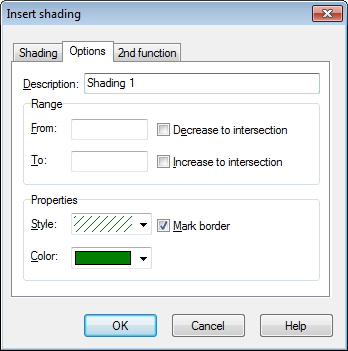
- From
Here you may enter a value, for which you want the shading to start. You specify the x-coordinate if you are using a standard function or the t-parameter if you are using a parametric or polar function. If you don't enter a value, the shading will start at negative infinity. If you place a check mark in Decrease to intersection, the start coordinate of the shading will be decreased from the entered value to the coordinate where the graph is crossing the axis, the edge of the graphing area, itself or another graph, depending of the type of shading selected.
- To
Here you may enter a value, for which you want the shading to stop. You specify the x-coordinate if you are using a standard function or the t-parameter if you are using a parametric or polar function. If you don't enter a value, the shading will continue until positive infinity. If you place a check mark in Increase to intersection, the end coordinate of the shading will be increased from the entered value to the coordinate where the graph is crossing the axis, the edge of the graphing area, itself or another graph depending of the type of shading selected.
- Style
Here you may choose between different styles to use for the shading.
- Color
Here you may choose the color of the shading.
- Mark border
Check this to draw a line around the border of the shading. Uncheck it to leave the shading without a border, which is useful if you want two shadings to look as one.
When you have chosen Between functions in the Shading tab, you may select the second function in the 2nd function tab. The dialog with the 2nd function tab is shown below.
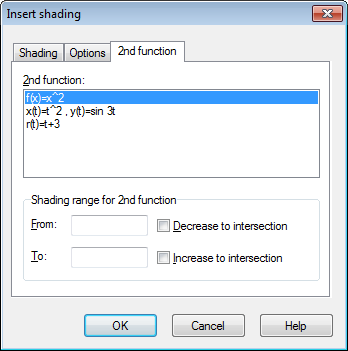
- Shading range for 2nd function
This is used to select the interval for the second function, just like you selected the interval for the first function in the Options tab. This is only available for parametric functions and not for standard functions. For standard functions the interval for the second function is always the same as the interval for the first function. If you enter neither a start nor an end of interval for a parametric function, the values for the first function will be used for the second function as well.
Shadings are a great way to mark an area, but if you get weird results, check that you selected the right function and the right interval. If you try to shade an interval crossing an asymptote or your shading is associated with a weird parametric function, you might get weird results. But really, what did you expect?