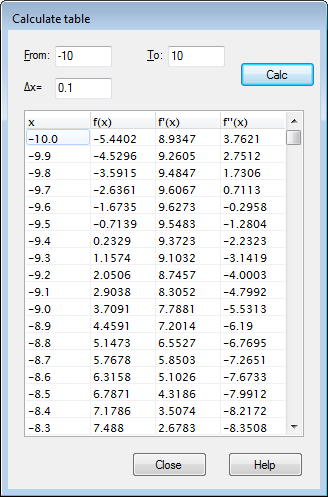
The dialog shown below is used to evaluate the selected function for a range. First select a function in the function list and use the menu item → to show the dialog. You specify the first and last value of the independent variable in the From and To fields. In the Δx or Δt field you specify the increment of the independent variable at each evaluation.
When you press the button, the table will be filled with the independent variable in the first column. The rest of the columns depend on the type of function. For a standard function, the table will show f(x), f'(x) and f''(x). For a parametric function, the table will show x(t), y(t), dx/dt, dy/dt and dy/dx. For a polar function, the table will show r(t), x(t), y(t), dr/dt and dy/dx. Unneeded columns can be hidden from the context menu. If the calculations takes a long time, a progress indicator will be shown.
You can select some cells with the mouse and right click with the mouse and use from the context menu to copy the cells to the clipboard. From the clipboard the data may be pasted into another program, e.g. Microsoft Excel.
When you move the mouse to the left side of the table the mouse pointer changes to a right pointing arrow. Now you can select whole rows with the mouse. When you move the mouse to the top of the table, the pointer changes to a down pointing arrow. Now you can select whole columns with the mouse. The whole table may be selected by right clicking and selecting . It is also possible to select cells by holding down the Shift key and using the arrow keys on the keyboard.
From the context menu it is also possible to export the selected data to a file as comma or tab delimited text.
Note that if you choose to create a lot of values in the table, it may take some time to calculate them. Many values may also take up a lot of memory from the system.