This dialog is used to insert a relation in the coordinate system.
Relation is a common name for inequalities and equations, also known as implicit functions.
To insert a relation you use the menu item → .
To change an existing relation, you first select it in the funktionslista and use → .
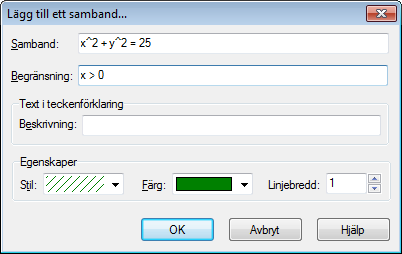
- Samband
Here you enter the relation you want to graph. This must either be an equation or an inequality.
xandyare used as the independent variables. An equation is a statement that one quantity equals another and the quantities must be separated by the = operator. For example the equationx^2 + y^2 = 25will plot a circle of radius 5.An inequality is a statement that one quantity is greater or less than another, and the quantities must be separated by one of the four operators: <, >, <=, >=. An inequality can for example be
abs(x) + abs(y) < 1. Two operators can be used to specify a range, for exampley < sin(x) < 0.5.You can use the same operators and built-in functions as for plotting graphs of functions. In addition you can also create custom functions.
- Begränsning
Here you can enter optional constraints, which can be any numeric expression. The relation will only be valid and plotted where the constraints are fulfilled, i.e. evaluates to a non-zero value. The constraints usually consist of a series of inequalities separated with the logical operators (
and,orxor). As for the relation,xandyare used as the independent variables.For example if you have the relation
x^2 + y^2 < 25, which is a shaded circle, the constraintsx > 0 and y < 0will only show the part of the circle in the 4th quadrant.- Beskrivning
Here you may enter a descriptive text to show in the teckenförklaring. If this field is left empty, the relation and constraints will be shown in the legend.
- Egenskaper
Here you may select a shading style for inequalities, color and width for equations. The shading Stil is only used for inequalities and is ignored for equations. To see overlapping inequalities they must use different styles. The Linjebredd indicates the size of the line drawn for equations and the width of the border line for inequalities. For inequalities the width can be set to 0 to avoid drawing the border line.