When you choose the menu item → , the dialog shown below will appear. In this dialog you can configure all options which are related to the axes. The dialog contains 4 tab sheets. The first sheet, shown below, contains options for the x-axis. The tab with options for the y-axis is completely analog to this.
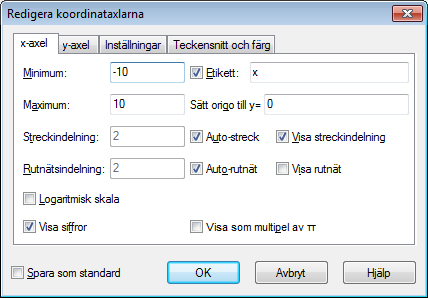
- Minimum
This is the lowest value on the selected axis. Default: -10
- Maximum
This is the highest value on the selected axis. Default: 10
- Streck
This is the distance between the tick marks on the selected axis. Tick marks are shown as small lines perpendicular to the axis. Streck is used for both tick marks and for showing numbers. With a logarithmic axis the Streck indicates the factor between the markers. For example Streck set to 4 will show 1, 4, 16, 64, etc. on a logarithmic axis while it will show 0, 4, 8, 12, etc. on a normal axis.
- Rutnät
This is the distance between the gridlines perpendicular to the axis. This is only used if grid lines are shown.
- Logaritmisk skala
Check this field if you want the axis to be scaled logarithmically.
- Visa siffror
When this field is checked numbers are shown on the axis with the distance chosen under Streck.
- Etikett
When this field is checked, the text in the edit box will be shown just above the x-axis in the right side of the coordinate system. For the y-axis, the text will be shown at the top to the right of the axis. You may use this to show what unit is used for the axes.
- The x-axis crosses at / The y-axis crosses at:
This is the coordinate where the axis will cross the other axis. This is only used when Koordinataxelstil is Korsade. Default: 0
- Auto
When checked the program will automatically choose a value for Streck that is fitting for the axes dimensions and size of the graphing area.
- Auto
When checked, Rutnät will have the same value as Streck.
- Visa
When this field is checked, tick marks are shown as small lines on the axis with the distance chosen under Streck.
- Visa
When this field is checked, grid lines will be shown as dotted lines perpendicular to the axis with the color chosen under Teckensnitt och färg and with the distance chosen at Rutnät.
- Visa som multipel av π
When this is enabled the numbers on the axis are shown as fractions multiplied by π, for example 3π/2. Visa siffror must be enabled for this option to be available.
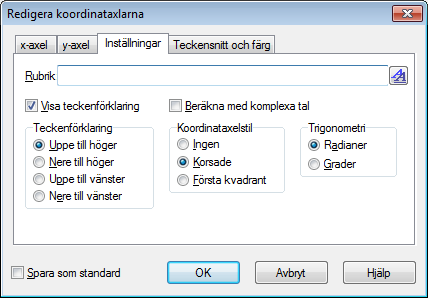
- Rubrik
Here you can enter a title that is shown above the coordinate system. Use the button to the right to change the font.
- Visa teckenförklaring
Check this to show the teckenförklaring with a list of functions and point series in the upper right corner of the coordinate system. You may change the font under Teckensnitt och färg.
- Teckenförklaring
Here you may choose in which of the four corners you want the teckenförklaring to be placed. You can also change this by right clicking on the legend in the graphing area.
- Beräkna med komplexa tal
Check this field to use complex numbers for calculations while drawing graphs. This will increase the time for drawing graphs but may be necessary in rare situations where the intermediate result are complex. The final result must be real for the graph to be drawn. This will not interfere with evaluations.
- Koordinataxelstil
Select Ingen if you don't want the axes to be shown. Select Korsade if you want a normal coordinate system. The location of the axes may be changed from The y-axis crosses at and The x-axis crosses at. Select Första kvadrant if you want the axes to be shown at the bottom and left side of the coordinate system, which will overwrite The y-axis crosses at / The x-axis crosses at.
- Trigonometri
Choose whether trigonometric functions should calculate in Radianer or Grader. This is also used for showing complex numbers in the polar format.
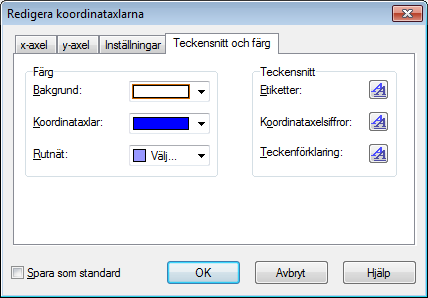
- Färg
You may change the background color, the color of the axes and the color used for drawing grid lines.
- Teckensnitt
You may change the fonts used to show axes labels, the font to draw numbers at the axes, and the font used for the teckenförklaring.
- Spara som standard
Check this to save all the current settings in the dialog to be used as default in the future. These settings are used the next time you choose to create a new coordinate system. The default settings are stored in your Windows user profile, i.e. each Windows user will have his/her own default settings in Graph.