When you want to insert a function, you use the menu item → to show the dialog below. To edit an existing function, you select it in the funktionslista and use the → menu item.
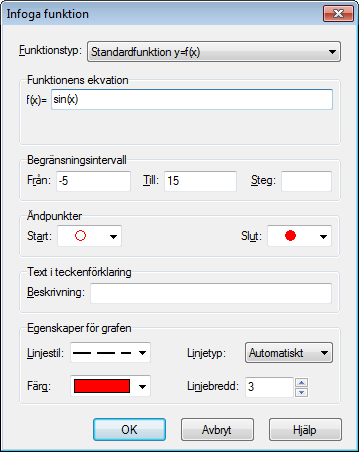
- Funktionstyp
You can choose between three different types of functions: Standardfunktion, parametric function and polar function. A standard function is defined as y=f(x), i.e. for each x-coordinate there is exactly one y-coordinate, though it may be undefined for some x-coordinates.
For a parametric function the x- and y-coordinates are calculated from an independent variable
t, called the parameter, i.e. a parametric function is defined as two functions: x(t) and y(t).A polar function r(t) indicates an equation to calculate the distance from the origin to a point on the function given an angle
t.tis the direct angle between the initial ray and the point on the function. This means that the x- and y-coordinates are given as x(t)=r(t)*cos(t), y(t)=r(t)*sin(t).- Funktionens ekvation
Here you enter the equation for the function. This can be f(x), x(t),y(t) or r(t) depending on the function type. Under Lista funktioner you can see all the available variables, constants and functions, which may be used to draw the graphs.
- Begränsningsintervall
You can choose an interval for the independent variable. Från and Till indicates the start and end of the interval. If the function is a standard function, you can leave one or both of them blank to draw the graph from minus infinity to plus infinity. If the function is a parametric function or a polar function, you always have to specify an interval. If the function is a parametric or polar function, you have to specify the number of steps for which you want the function to be evaluated. When you specify a higher number of steps, the graph will appear smoother, but it will take longer to plot. It is preferred to leave the Steg field blank for standard functions to let Graph decide the optimal number of steps. You can however enter the number of steps if the graph doesn't show enough details, for example if an asymptote is not shown correctly. Notice that the Steg only specify a minimum number of calculations. Graph may add more steps at critical points if Linjetyp is set to Automatiskt.
- Ändpunkter
Here you can choose to show markers at the start and/or end of the interval. If no range is specified, the endpoints will be showed where the function enters and leaves the graphing area. The default is not to show any markers.
- Text i teckenförklaring
Enter a description to be shown in the teckenförklaring. If the text is empty, the function equation will be shown in the legend.
- Egenskaper för grafen
You can choose between different line styles for which you want the graph to be drawn. You can choose between solid, dashed, dotted or a combination of these. Linjestil is only available when Linjetyp is set to Linjer or Automatiskt. When Linjetyp is Punkter, only a dot is shown at each calculated point. Likewise the Linjer Linjetyp will connect the calculated points with lines. Automatiskt will also draw lines, but Graph will do more calculations at critical points if it thinks it will improve the graph. It will also break the line if it thinks there is an asymptote. You can also choose the width of the graph. The width is notified in screen pixels. There are also a lot of different colors you can choose between. The program will remember and suggest the same properties last used.