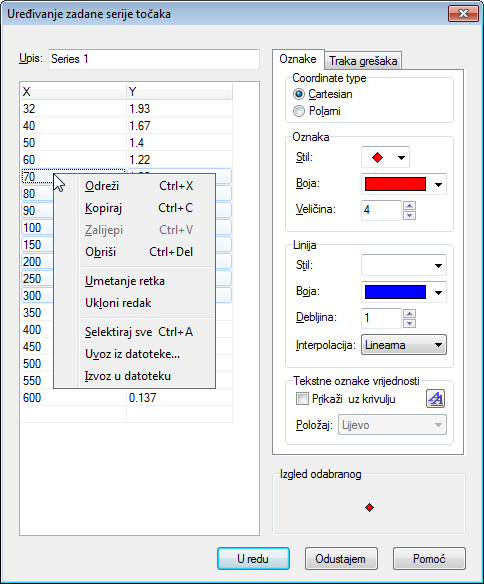
You can use the dialog below to add a series of points to the coordinate system. The points will be shown in the coordinate system in the graphing area as a series of markers. To insert a new point series, you use → . To change an existing point series, you first select it in the panel unosa and use → .
Nakon unosa serije točaka možete unijeti liniju trenda koja će najbolje pratiti vaše točke.
U tablicu unosite x- i y-koordinate. Možete ih unijeti neograničen broj, ali svaka x-kordinata mora imati pripadnu y-kordinatu.
Označavanjem dijela ili cijele serije točaka, desnim klikom miša i kroz pomoćni izbornik, kopirate odabrano u druge programe. Na sličan način možete iz drugih programa npr., MS Word-a ili MS Excel-a kopirati podatke u ovu tablicu.
Kroz pomoćni izbornik možete u Graph uvesti podatke koji su u datotekama odvojeni tabulatorom (novi red), zarezom ili dvotočkom. Podaci se smještaju na mjesto uvoza pa tako možete uvesti podatke iz više datoteka npr. x-koordinate iz jedne, a y-koordinate iz druge. Kad uvozite podatke samo iz jedne datoteke, što je uobičejeno, pozicionirajte se u prvo gornje lijevo polje tablice.
- Opis
U gornje polje ovog okna unosite naziv serije koji će prikazati legenda.
- Coordinate type
You need to choose between the type of coordinates used for the points. Cartesian is used when you want to specify (x,y)-coordinates. Polarni is used when you want to specify (θ,r)-coordinates, where θ is the angle and r is the distance from the origin. The angle θ is in radijani or degrees depending on the current setting.
- Oznaka
Ovdje odabirete različite oblike oznaka točaka, njihovu boju i veličinu. Odabirom veličine 0, neće biti nikakvih oznaka, ni na traci grešaka.
Ukoliko odaberete strelice, one će biti tangente u pripadnoj točci. To ovisi o postavci Interpolacija. Prva točka nikad nije prikazana strelicom.
- Linija
Između točaka možete umetnuti linije različitog stila, boje i debljine. Iscrtavat će se prema redoslijedu mreže. Naravno, možete odabrati i bez linija.
You can choose between four types of interpolation: Linearna will draw straight lines between the markers. 1D cubic spline will draw a natural cubic spline, which is a nice smooth line connecting all the points sorted by the x-coordinate with 3rd degree polynomials. 2D cubic spline will draw a smooth cubic spline through all points in order. Pola sinusoide will draw half cosine curves between the points, which might not look as smooth as the cubic splines but they never undershoot/overshoot like the cubic splines can do.
- Tekstne oznake vrijednosti
Put a check in Prikaži uz krivulju to show Cartesian or polar coordinates at each point. You may use the
 button to change the font, and the drop down box to select whether the labels are shown over, below, to the left or to the right of the points.
- Traka grešaka
Here you can choose to show horizontal or vertical error bars, also known as uncertainty bars. They are shown as thin bars at each point in the point series indicating the uncertainty of the point. There are three ways to indicate the size of the error bars: Fiksno is used to specify that all points have the same uncertainty. Razmjer is used to specify a percentage of the x- or y-coordinate for each point as uncertainty. Prema želji will add an extra column to the table where you may specify a different uncertainty value for each point. All uncertainties are ±values. Custom Y-errors are also used to weight the points when creating trendlines.